
In the conclusion of my last post Data Leak Visibility, I mentioned that Elasticsearch, Logstash and Kibana (ELK) stack can be used to aggregate data from multiple osquery agents and can be used to analyze the data. This post will provide a high level view of what was done to connect the agents to the ELK stack and how I was able to not only analyze the data, but also to create very useful visualizations of the data from multiple sources.
Let us start with a high-level view of what my deployment looks like.
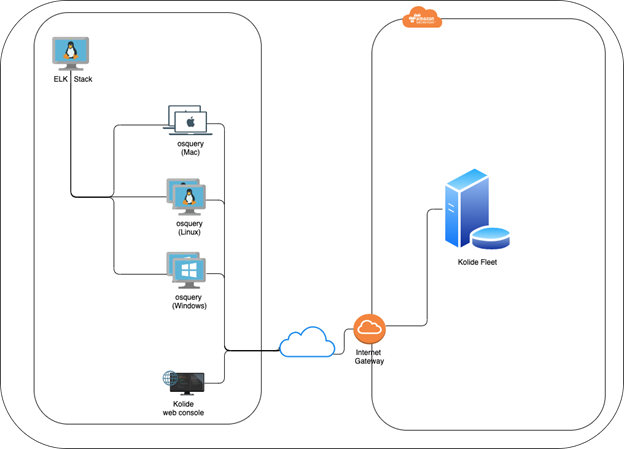
I have a Kolide fleet manager setup in AWS cloud as described in my previous post Data Leak Visibility. There are multiple ways to deploy the ELK stack; a) It can be deployed as a docker container locally or in the cloud; b) AWS provides a fully managed Elasticsearch service; or c) Local Linux (CentOS or Ubuntu) machine with an ELK stack. I chose option (c), but had to ensure that the machine had a static IP assigned to it. In a typical enterprise deployment, option (b) would be a good choice as it is a fully managed service, albeit at a higher cost. In fact, both for fleet manager and ELK stack, cloud deployment is the way to go, since this provides full visibility into users within the enterprise and those not connected to the enterprise network i.e. those working from home.
Shipping Endpoint Data to ELK
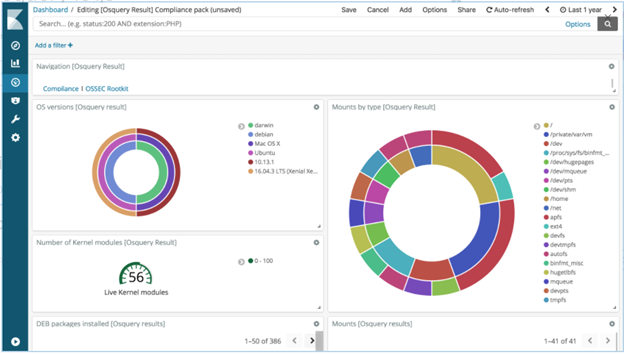
There are a number of ways to ship the data that is collected by osquery to the ELK stack as described in Aggregating Logs. Another way is to use Filebeat directly to read the osquery results and ship the data to the ELK stack. I chose the Filebeat method because it allows Kibana to display a pre-canned dashboard for an osquery pack named “it-compliance”. The dashboard provides visibility into the managed fleet Operating Systems (currently Darwin and Linux only), mount points and installed DEB packages.
Querying data using Kibana
Once Elasticsearch is set up with osquery and Filebeat running, it is easy to analyze the data being ingested into your Elasticsearch stack using Kibana. Typically, in an enterprise environment one can enable osquery packs for specific needs (compliance, vulnerability management, monitoring, etc.), but I would recommend not hardcoding the osquery configuration using local configuration file and instead using Kolide fleet manager to deploy configuration and packs. The Kolide fleet manager provides an intuitive UI to create and test the queries.
There is also a great tool called fleetctl created by the authors of Kolide fleet, to manage the manager configuration and for conversion of osquery packs. This was very useful for my setup.
Once the query results are validated, they can be deployed either via the fleetctl tool or the UI to deploy them as packs directly from the manager. When creating the pack, it requires the previously created query, the interval (how often to run the query), the platform(s) and the type of logging.
As an example, I created and deployed an osquery pack to gather results for the printed documents from all my macOS machines:
Query: SELECT * FROM cups_jobs
Interval: 3600
Minimum version: All
Logging: Differential (Ignore Removals)
Once the pack is deployed and runs, osquery will write out the results of the query to osquery.results.log file. Filebeat will pick up the results and ship them to ELK stack which are then ingested by Elasticsearch. At this point it is possible to start analyzing the data.
As an example, I ran the following query in Kibana to identify if a specific confidential document was ever printed by any users.
osquery.result.name : "pack/mac-dlp/darwin-print-jobs" and osquery.result.columns.title: "Financial Data - Confidential.pdf"
As shown below, I was able to identify which user printed a confidential document and when it was printed:

Expanding the result, it is possible to see which user printed this document and the date/time in Epoch (converted: Tuesday, August 25, 2020 12:40:30 PM GMT-07:00 DST):

Note: Filebeat configuration is set up to prefix all results with a “osquery.result” tag, so when creating a search query in Kibana, as one types “osquery.result”, it will list all available tables and fields associated with osquery.
Here is another example of identifying if a particular confidential document was copied to USB or a file share.
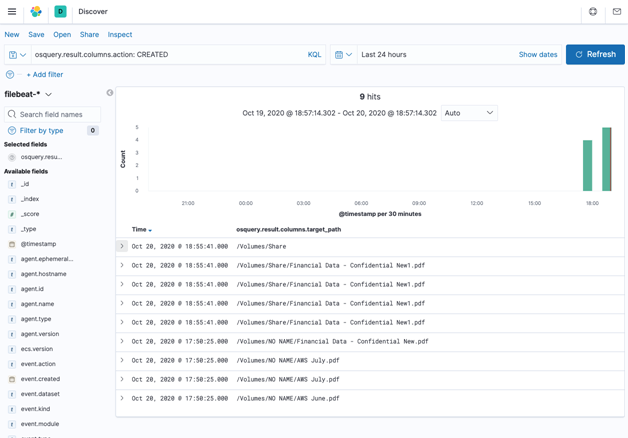
Visualizing Data using Kibana
Kibana includes the ability for users to create visualization of the data, which can be effective for data analysis. In my case, I wanted to visualize what documents have been printed from all the machines in my fleet. The following shows the count of each printed document:
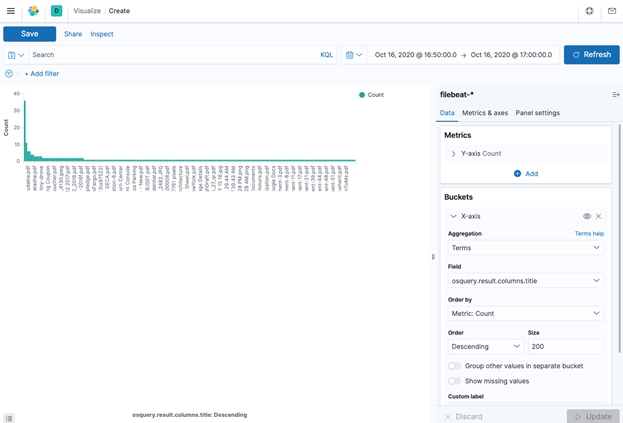
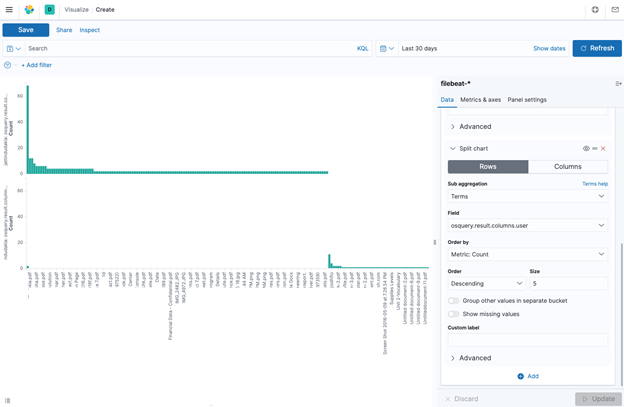
In addition, if one wanted to visualize the users who have printed the documents, one could create a Split chart by rows with a sub aggregation on the term “osquery.result.column.user”. This will display a bar graph for each user and what documents they printed as shown below:
Conclusion
The combination of osquery, Kolide fleet manager and ELK stack presents a very powerful set of tools in an arsenal of Cyber security tools needed to protect against potential threats and Data Leak Information (DLI).
Security vendors are selling similar tools at exorbitant costs and can be cost prohibitive for small to medium size businesses (SMB) with limited IT budgets. While the Cyber security threats continue to grow with the increased risk due to employees working from home, utilizing the tools described here would be invaluable for most organizations.
